Faster Data analysis is essential for making decisions that impact the progress and, especially, the continuity of any business.
The metrics management and indicators are relevant pillars for analysis, planning, and decision-making in strategic sectors.
Grafana is a tool for optimizing internal processes, define and monitor metrics and indicators, and identify weaknesses.
Grafana connects to all possible data sources and gives you a visual experience with its dashboards.
Are you ready to have more control of your applications and your business?
Why is Grafana so special?
Grafana is an open-source solution to perform data analysis, obtaining metrics, and monitoring our applications with the help of customizable dashboards.
Can connects to all possible databases, such as Graphite, Prometheus, Influx DB, Elasticsearch, MySQL, PostgreSQL, some of which you can only use in the Enterprise version, the paid version of Grafana.
As an open-source solution, Grafana allows writing new plug-ins for new integrations with several data sources.
Grafana’s objective is to help study, analyze and monitor data over some time, called Data Source. Each source has a custom query editor for the resources.
Imagine a large visualization panel with metrics analysis in real-time through personalized graphs, this is Grafana.
With this large panel, it is possible to alert, consult and understand relevant information, no matter where it is stored.
Think about the possibilities, such as tracking user behaviour, application behaviour, frequency of errors that appear in production or a pre-production environment, the types of errors that appear, and contextual scenarios, providing relative data.
All this is possible and happens through a single, intuitive and complete interface. As a result, decision-making becomes faster and efficient, thanks to the management of indicators and the monitoring of real-time data.
Thus, analysts from different sectors can configure different dashboards with different collected databases.
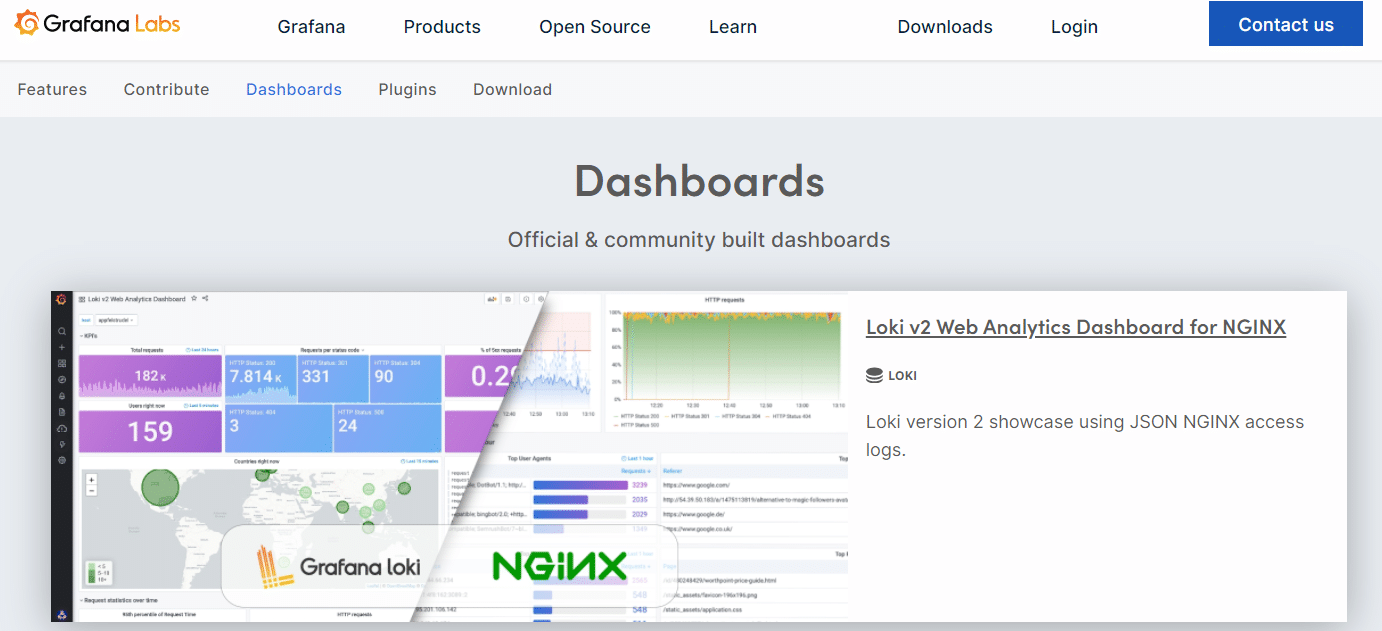
To optimize the agility construction of Dashboards, Grafana Labs makes it possible to download several models of Dashboards for each type of need.


Different teams can visualize distinct information extracted from a group of databases to create and visualize indicators in a gorgeous dashboard.
Also, Grafana offers continuous metrics analysis and alerts configurations, making you receive warnings according to the rules you define.
Its architecture allows installation on Ubuntu / Debian, Centos / RedHat, Windows, Mac, and Docker operating systems; has support for several databases, free or paid. And it also offers the alternative of working as a cloud service with connection via IP and access port.
What is a Grafana Dashboard?
A dashboard is a set of one or more panels organized and arranged into one or more rows. Grafana ships with a variety of Panels. Grafana makes it easy to construct the right queries, and customize the display properties so that you can create the perfect dashboard for your need.
Each panel can interact with data from any configured Grafana Data Source (currently Graphite, Prometheus, Elasticsearch, InfluxDB, OpenTSDB, MySQL, PostgreSQL, Microsoft SQL Server)
Grafana is designed so that each panel is tied to a data source. Because the Grafana dashboards support multiple panels in a single grid, you can visualize results from multiple data sources simultaneously.
The panels contain a range of visualization options, such as geographic maps, heat maps, histograms, all the variety of tables and graphs that a company normally requires to study their data.
To learn more about Dashboards here is the official overview.
How to install?
To discover how to install and configure a Grafana instance there is a tutorial in our Community.
This link will serve you as an installation guide for Ubuntu.
And we hope with this new tool the improvement of your projects!


